Styling Layers
The Style panel on the right edits the appearance of the layer selected in the Layers panel. Vector and raster layers each get their own set of controls.
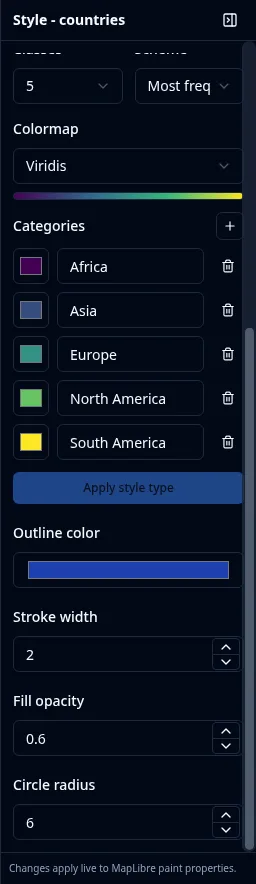
Vector styling
For vector layers the Style panel covers fill, stroke, points, labels, and 3D extrusion:
- Fill: fill color and fill opacity for polygons.
- Stroke: line color and width for lines and polygon outlines.
- Points: circle radius for point layers.
- Labels: text color, size, halo color, and halo width.
- 3D extrusion: turn polygons into extruded blocks, with a height field, height scale, base height, and color. Advanced expressions are available for both height and color.
You can also set a per-style minimum and maximum zoom so a style only applies within a zoom range.
Point renderer (heatmap and clustering)
For point-only GeoJSON layers — whether dropped on the map, produced by a tool, or loaded through Add Vector Layer in the geojson render mode — the Style panel adds a Point renderer control:
| Renderer | Description |
|---|---|
| Single symbol | One circle per point (the default). |
| Heatmap | A density surface colored from cold to hot. Adjust Heatmap radius (the kernel size in pixels) and Heatmap intensity. |
| Clustered | Group nearby points into bubbles labeled with the count; zooming in splits them apart. Adjust the Cluster radius (in pixels) and the Cluster max zoom above which points stop clustering. Individual (unclustered) points keep the layer's circle style. |
The renderer choice is saved with the project.
Style type (data-driven styling)
The Style type control chooses how feature values map to color:
| Style type | Description |
|---|---|
| Single symbology | One uniform style for every feature. |
| Graduated | Classify a numeric field into classes with a color ramp. Choose the field, the number of classes, a classification scheme (such as equal interval or quantile), and a colormap. |
| Categorized | Assign a color per unique category value of a field. |
| Expression | Drive styling with a custom MapLibre expression for full control. |
For graduated and categorized styles, GeoLibre generates the class breaks or category stops and shows them in the panel, where you can fine-tune individual colors before applying.
Style interchange and URL styles
The selected vector layer's Layer actions → Styles submenu imports and exports GeoLibre URL style JSON, Mapbox/MapLibre style JSON, OGC SLD, and QGIS QML. A GeoLibre URL style is a compact MapLibre style whose feature data is supplied separately through the data URL parameter. Export one when you want to publish the current symbology beside hosted GeoJSON or a ZIP of GeoJSON files; import it when you want to apply that symbology to a layer already open in GeoLibre.
See Managing Layers for the menu workflow and Embedding & Sharing for the JSON conventions.
Choropleth maps
To make a choropleth, select Graduated, pick a numeric attribute, choose a colormap, and click Apply style type. See the Your First Map tutorial.
Raster styling
For raster layers the Style panel exposes image adjustments:
- Brightness (minimum and maximum)
- Saturation
- Contrast
- Hue rotation (in degrees)
These let you tune the look of GeoTIFF, COG, and tile-based raster layers without changing the underlying data.
Spectral profile
For a multiband raster — a stacked Landsat or Sentinel scene, a NetCDF/HDF cube, or any COG with more than one band — the Style panel adds a Spectral profile chart of one pixel's value across every band.
Turn on Identify for the layer in the Layers panel, then click the map. Each click adds a numbered dot on the map and a matching curve in the chart, so you can click water, vegetation, and asphalt and compare the three responses side by side. Up to six points are compared at once; older points age off as you add more.
- The chart plots against wavelength when the file declares one wavelength per band, and against band number otherwise. A wavelength list that doesn't match the band count is ignored rather than trusted, so a stale one can't mislabel the axis.
- Only the tile containing the clicked pixel is fetched, not the whole scene, so profiling a large remote COG stays fast.
- Pop out floats the chart in a draggable, resizable window over the map; PNG and CSV export it.
Single-band rasters produce no profile — use Identify on its own to read the pixel value. Clicks outside the raster, or on a pixel that is nodata in every band, are dropped without disturbing the points you have already collected.
A remote GeoJSON, GeoParquet, or vector PMTiles layer opened with the data URL parameter can receive a GeoLibre/MapLibre vector style through style. A remote COG can receive a raster style instead. Raster URL styles support band mode and selection, rescale ranges, colormap and reversal, nodata, opacity, gamma, stretch, and normalized-difference index presets. See the remote data examples.
Legends and colorbars
To display a legend or a continuous colorbar on the map, open them from the Controls menu. They reflect the styling you set here.